Do you like the idea of a trading system that doesn’t involving you staring at the markets every day?
One by which you might make five or six trades a year – certainly no more than ten – in a market that you can get in and out of easily?
And one by which you should comfortably be able to beat an index, such as the FTSE or gold?
Then I may have something for you in today’s Money Morning…
How to profit from market momentum
Late last week, I had the pleasure of meeting Andrew Craig who runs the website, plainenglishfinance.com. He’s just published his first book, Own The World, about plucking your finances from the expensive hands of fiends, financial advisors, and fund managers, and taking control of them yourself.
We were discussing how it shouldn’t be that hard to make 15% or 20% a year, and how few fund managers or even private investors manage this. By the time you compound that over several years, you’re talking serious money.
Andrew swears he can beat most markets by using a simple tool called the relative strength index – the RSI.
Let me start by explaining how it works. In short, RSI measures momentum. It’s an indicator of whether something is ‘oversold’ or ‘overbought’. When it reaches ‘overbought’ levels, you sell. When it reaches ‘oversold’ levels, you buy.
Andrew uses it in conjunction with other indicators, both technical and fundamental, but for the purposes of today, we’ll use it by itself.
Most chart websites – such as Big Charts or Stockcharts – give you the option of seeing the RSI beneath whatever price you are looking at.
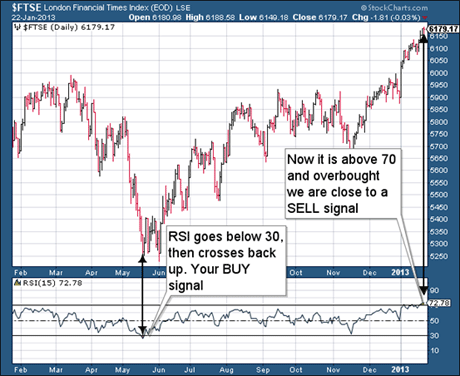
Below we consider the FTSE 100 over the past year.

You can see how in May, the RSI went below 30, deeming it oversold. We were in buy-signal territory. Some traders like to use the moment it crosses back through 30 as the actual buy signal. At this point, the FTSE 100 was at around 5,250.
Now that the RSI has gone above 70, it is ‘overbought’. This suggests that you should be thinking about taking profits – or at least sticking in a very tight stop to protect them, if you think the market has further to run. The moment it crosses back down through 70 is the moment many traders use as their sell signal.
Let’s assume that we have a sell signal now, for the sake of argument. At 6,180, you’ve made over 900 points.
With just one trade last year, it involved low commission costs. You didn’t have to spend all your time looking at screens – you could have got on with that important skiing holiday. You got in close to the low for the year and you made about 18%. Nice work!
Why you shouldn’t rely on just one indicator
Of course, this is just one example where the method happens to have worked well. Back-testing it, there are plenty of examples where it hasn’t.
For example, in a bull market, you tend to get a lot of overbought readings – sell signals – and very few, if any oversold readings – buy signals. You sell, the market carries on its rapid ascent and you miss out. Very frustrating.
(In fact, judging by readers’ emails, investors find missing out on a run even more frustrating than being trapped in a bear market.)
The same applies in a severe bear market. In 2008, for example, there were a lot of oversold readings – which might have made you buy – only for the market to head a lot lower.
This is why RSI tends to work best when used in conjunction with something else. This might be some fundamental analysis you have done or read on a market. Perhaps the economics and financials are such that you really feel you should own a certain asset, and just want to find the best time to get in.
Or it might be another technical tool, such as moving averages, (which I like). Or it might be a tip from somebody, another trader or a newsletter writer, who you follow.
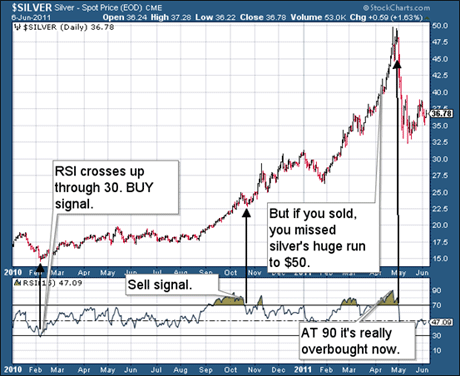
Here’s a good example of why you need to be careful about relying on just one indicator. The chart below shows silver in 2010-11 – when it made that huge run from $15 to $50.

The RSI gave a lovely buy signal at $15 in February 2010. The following October it gave a sell signal at around $23. That made you $8 in as many months.
Very nice trade. Open the champagne.
Then look on in horror as, without giving another buy signal, silver launches all the way to $50 without ever seeing $23 again. (Something similar happened to me, you may remember, as I wrote about taking some profits at, I think, $30.)
That’s why I advise using this indicator in conjunction with something else. Andrew, for example, says he held on when he got his first sell signal on silver because the volumes were so strong. Volume is pretty telling as far as interest in a market is concerned.
Another way to use this indicator – if you have the facility on your charting software – is to change the parameters of RSI. (Stockcharts offers this facility.) I have used website’s default settings above (that’s the 14 day RSI). Playing about, I have found that a ten-day RSI works well for a gold, although it gives you a lot more than one or two trading signals a year.
Currently the major indices – the Dow, the S&P, as well as the FTSE – are all approaching overbought levels. Gold and silver both issued buy signals in late December, having given sell signals back in December.
I’ve decided I like RSI and will use it a lot more in future to help me with my market timing. If you want to find out more about Andrew’s book, Own The World, and his work, visit www.PlainEnglishFinance.com.
Category: Market updates

