There are, as I see it from the vantage point of my South London hide-out, two huge financial forces at work in the global economy.
We have the natural forces of deflation. Debt being paid down, credit tightening, houses being put in order – the inevitable deleveraging after a period of excess.
And we have the artificial forces of inflation. Systematic currency devaluation – the printing of money to buy bonds and supress interest rates in an attempt to re-inflate asset prices and stimulate growth.
The secret of success as far as trading equity and bond markets is concerned has been to correctly identify which force is dominant. In other words, to figure out whether or not we’re in an inflationary or deflationary cycle.
But how can you tell? And which are we in now?
Which way will the market head next?
Although things have slowed over this past week, we do still seem to be in an inflationary phase as far as stock markets are concerned. But are markets topping out before the next inevitable phase of deflation? Or is this a gentle slowing before the next bout of price rises? How does one know?
I suggested a simple method of technical analysis last week that takes the thinking out of the decision-making process – thinking can be a dangerous thing after all.
Nevertheless, we all do it at least some of the time. And I’ve been thinking hard this week about other ways to identify whether we’re in an inflationary or deflationary phase. And I may have come up with something.
Just as gold is a key holding of any hard-core inflationist, so government bonds make up a large portion of any hard-core deflationist’s portfolio. The US government bond market is the biggest market in the world. It can reveal a great deal about where money is flowing.
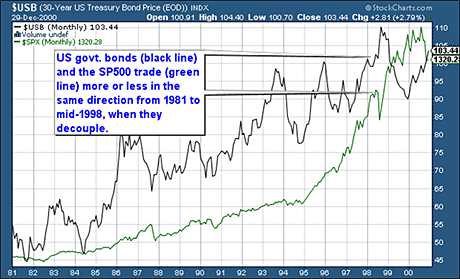
In the chart below you can see US government bond prices (in black), and the S&P 500 (in green), between 1981 and 2001.

As you can see, US government bonds, which had a rotten time of it during the inflationary 1970s, have been in a bull market since late 1981. And broadly speaking, for much of the time, they traded in the same direction as equities. When the S&P 500 rose, so did 30-year government bonds. When bonds fell, equities were either flat or they eventually fell too.
This was the case until mid-1998. Then they decoupled. Equities fell with the Asian crisis, while government bonds rose. When equities recovered, bonds fell. In other words, during equity routs, investors have flooded to the perceived safety of government bonds and bond prices have risen. When investors get greedy again and decide equities are OK, they move their money from bonds back into the stock market.
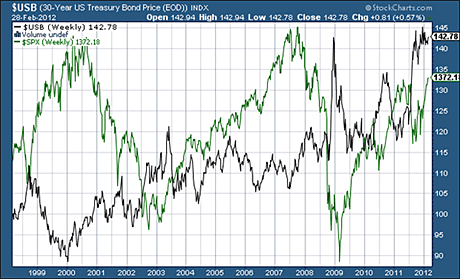
Here we see bonds and stocks from 1998 onwards. US bonds fell as equities rose into 2000. Then the bond market rallied to 2003, as equities fell in the dotcom bust. During the mega-run in equities between 2003 and 2007, US bonds traded in a range while equities surged ahead. Then bonds had a huge rally with the 2008 stock-market bust, fell with the subsequent rally from 2009, and then rallied with the bear market in stocks of 2011.

The bond market is signalling that we’re back in inflation mode
But here’s the thing: since the October 2011 low, the stock market has rallied some 30%. But the bond market has not suffered the corresponding falls you might have expected. It is trading damn near its all-time highs.
There are all sorts of possible reasons for this: money fleeing Europe, or the relative strength of the US dollar, for example – you could come up with any number of things.
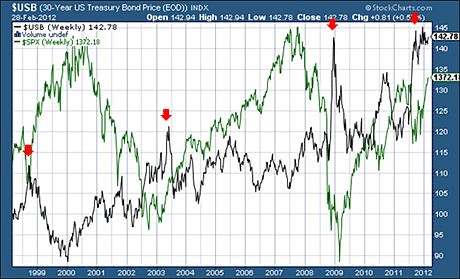
But here’s what I’ve noticed. Below is the same chart as the one above, except in this case, I’ve popped in a red arrow to mark each time the US bond market (black line) has moved to the top of its range.
Now look at what’s happened to the S&P 500 (green line) in the subsequent few months. Can you see? Highs in the bond market have frequently anticipated rallies in the stock market. It even worked to a limited extent in the deleveraging fiasco of 2008.

Why am I mentioning this now? Well, I don’t know how much lower interest rates can go – or how much higher US government bond prices can get – but I wouldn’t have thought that yields can go much lower than this. If they do, and the bond market breaks above say 145, then I’m wrong and we’re probably into another deflationary phase. But for now we are certainly at the upper end of their range. I suggest that equities are not a sell until bonds move to the lower end.
Yes, I know that it goes against the grain to buy into anything after it’s just had a 30% move up. I know valuations are getting a little rich, particularly in tech stocks. I know that sentiment is a little too bullish. I can find a hundred reasons why equities are set to crash. And it may be that bonds and equities have re-coupled again after their 13-year divorce and, just as the Asian crisis separated them, the European crisis has re-united them. The jury is still out on that one.
But for now the bond market is telling me that the inflation trade – or that risk – is back on. That means that cash is not the place to be, but assets – be it gold, equities or commodities – are. I’m still looking for a correction in equities, by the way, but I don’t think it’ll be the big kahuna and so pullbacks could be a buying opportunity. If the bond market heads back to the lower end of its range – in the low 120s – well, that’ll be your cue to start heading back into the deflation bunker.
And just before I go: I’m heading out to Canada next week for the PDAC, which is the biggest mining conference in the world. All the great and the good – not to mention the dastardly and the incompetent – of the digging and drilling world will be there. I’ll let you know what I learn when I get back.
• This article is taken from the free investment email Money Morning. Sign up to Money Morning here .
Our recommended articles for today
Bankers don’t have talent – just lots of borrowed money
The claim that banks need to offer astronomical salaries and bonuses to attract the best talent is a myth, says Phil Oakley. Here’s the proof.
How a ‘Venezuelan Spring’ could push down oil prices
A defeat for Hugo Chavez in Venezuela’s presidential elections could be a ‘game-changer’ for oil prices, says Matthew Partridge.
Category: Market updates

