How much trouble is Europe in? This chart sums it up

Updated 9 November 2011

Money Morning gives you the latest on the eurozone crisis. This scary chart sums it up:
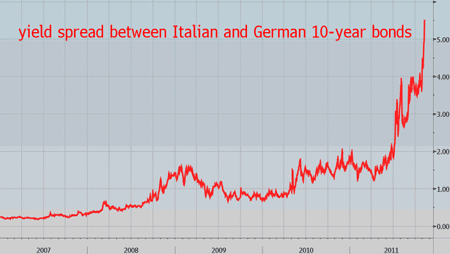
Italian and German ten-year sovereign bond-yield spread

The yield on a country’s bonds shows how confident investors are that it’ll be able to repay its debts. The lower the yield, the more comfortable investors feel about lending, and vice versa.

This chart shows the spread between Italian and German ten-year bond yields. The higher the red line climbs, the more Italy must pay compared to Germany to borrow. So, that gap is a key measure of confidence in the country, and by extension, the eurozone.

This spread is now widening fast – Italy now has to pay about 5.5% more than Germany to fund its deficits. In other words, market confidence in Italy’s finances is collapsing.

Source: Bloomberg

For more, see our eurozone bond yield charts.

Category: Market updates

From time to time we may tell you about regulated products issued by Southbank Investment Research Limited. With these products your capital is at risk. You can lose some or all of your investment, so never risk more than you can afford to lose. Seek independent advice if you are unsure of the suitability of any investment. Southbank Investment Research Limited is authorised and regulated by the Financial Conduct Authority. FCA No 706697. https://register.fca.org.uk/.

© 2021 Southbank Investment Research Ltd. Registered in England and Wales No 9539630. VAT No GB629 7287 94.
Registered Office: 2nd Floor, Crowne House, 56-58 Southwark Street, London, SE1 1UN.

Terms and conditions | Privacy Policy | Cookie Policy | FAQ | Contact Us | Top ↑