Down, down, down… and then all of a sudden UP all at once.
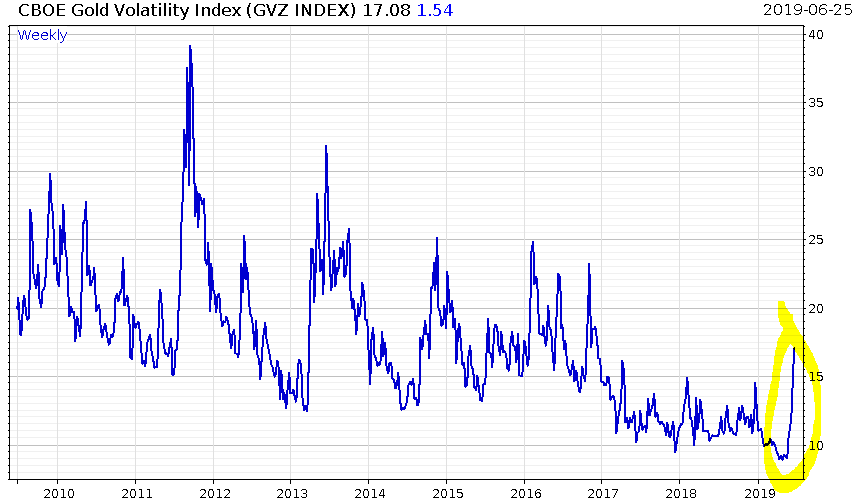
This is a rather esoteric chart, but one I’ve become increasingly interested in over time:
What this chart displays is what’s known as the “implied volatility” of gold.
What that essentially means is how volatile traders expect the gold price to be in the near future (in practice, it’s the cost of insuring against a big move up or down in the options market).
For the last couple of years gold volatility, or “vol”, has been crushed. Traders haven’t been expecting big moves either way, and the cost of insuring against such moves has just got cheaper and cheaper. Until now.
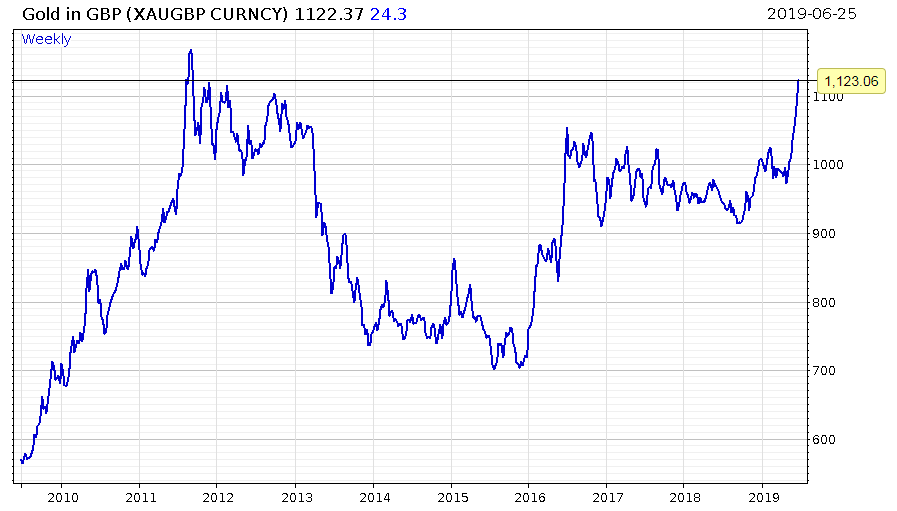
As I said yesterday, 2019 is looking like 2016, but more so. The Federal Reserve signalling lower interest rates has led to a multicurrency gold breakout, which in the case of the pound has meant gold retaking the sunlit uplands of 2011:

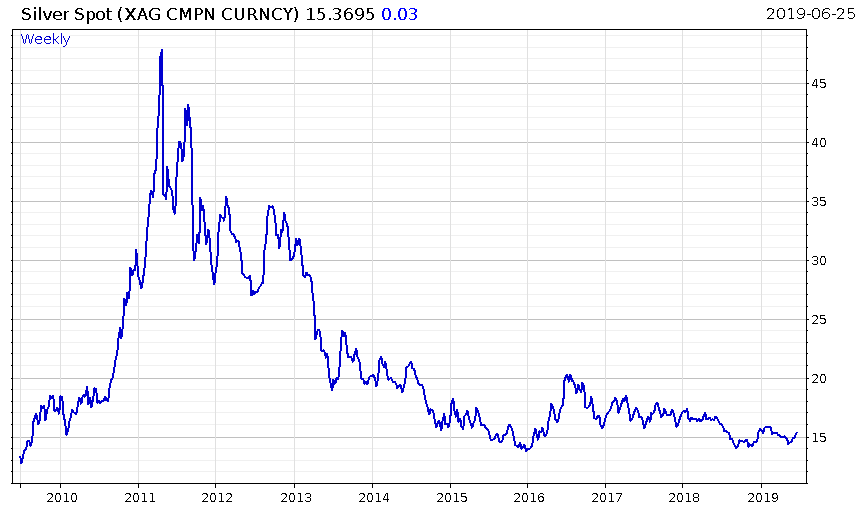
But silver, which normally does whatever gold does but more so, is barely stirring:
If gold is really leading us back into bull market for precious metals, silver may be a cheap way to get exposure. I’ll need to ask Tim Price what he thinks – he’s just about to arrive in the office for our quarterly conference call for subscribers to The Price Report. He knows the precious metals market inside out, and I’m looking forward to getting his insights on the recent move…
More to come tomorrow…
Boaz Shoshan
Editor, Capital & Conflict
Category: Market updates


