Growth in jobs is crucial if an economy is going to expand. If more people get work, that will mean extra spending and higher growth. But if dole queues get longer, economies will suffer.
No wonder that job creation in the world’s biggest economy, the United States, is one of the most widely watched indicators on the planet.
Our favourite US jobs measure – updated every week – is the ‘initial jobless claims’ (IJC) number. It shows how many Americans are claiming state unemployment benefits for the first time.
In particular, the four-week moving average of IJCs, which filters out the weekly ‘noise’, has been a great pointer to future changes in the US economy. What’s more, it’s just as good for the stock market too.
The latest figures are just out. For the week to 24 June, IJCs fell 1,000 to 428,000. That was worse than expected – economists expected a drop to 425,000. And the four-week moving average nudged up to 426,750, meaning that average IJCs are almost 8% higher than four months ago.
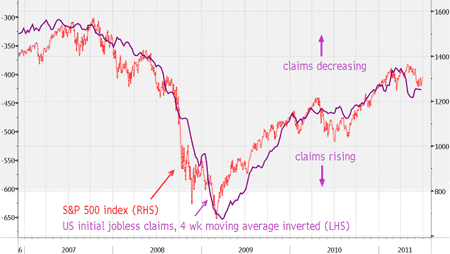
What does this mean for the stock market? Look at the chart:

(Source: Bloomberg)
(Click on the chart for a larger version)
The purple line is the inverted IJC four-week moving average. The higher this moves on the chart, the fewer claims are being submitted. So a rising purple line is good news, and a falling line bad news.
The red line is the S&P 500 index, the world’s most watched stock market index. The IJC figures forecast its May drop to a tee. And the latest slide in IJC four-week moving suggests that US stocks may still fall further.
Category: Economics

