Jobs growth is key to economic expansion.
More people in work means extra spending and higher growth. But if dole queues lengthen, economies suffer. In the US, the world’s biggest economy, employment is one of the most widely watched indicators.
People tend to watch the monthly non-farm payrolls number. The latest figures on that, out today, were appalling – the US economy added just 18,000 jobs compared to expectations for more than 100,000, while the unemployment rate hit 9.2%.
But our favourite US jobs measure – which is updated every week – is the ‘initial jobless claims’ (IJC) number. It shows how many Americans are claiming state unemployment benefits for the first time.
The four-week moving average of IJCs, in particular, filters out the weekly ‘noise’. So it gives you a better idea of the trend. And it’s been a great pointer to future changes in both the US economy and the stock market too.
The latest figures show that for the week to 1 July, IJCs fell 10,000 to 418,000. That was actually a touch better than expected – economists expected a drop to 420,000. And the four-week moving average nudged down to 424,750. But this still means that average IJCs are almost 9% higher than three months before.
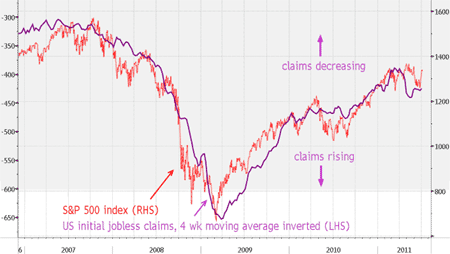
What does this mean for the stock market? Look at the chart…

Source: Bloomberg
The purple line is the inverted IJC four-week moving average. The higher this moves on the chart, the fewer claims are being submitted. So a rising purple line is good news, and a falling line bad news. The red line is the S&P 500 index, the world’s most watched stock market index.
The IJC figures forecast its May drop, and recent rally, to a tee. But the failure of the IJC four-week moving average to recover any further suggests that the latest bounce in US stocks may be short-lived – and the poor data on non-farm payrolls may help to end that bounce.
Category: Economics

