Job indicators are good guides as to how well an economy is really doing.
More people working means extra spending and growth, and likely higher share prices, too.
But if dole queues get longer, an economy and many of its businesses will suffer.
US ‘initial jobless claims’ (IJC) show how many Americans are claiming state unemployment benefits for the first time. And the four-week moving average of IJCs, which filters out the weekly ‘noise’, has generally been a handy pointer to future changes in both the US economy and the stock market.
For the week to 24 September, IJCs dropped by 37,000 to 391,000. And the IJC four-week moving average dipped by 5,250 to 417,000.
On the surface, these are stunningly good numbers. So – despite many recent gloomy headlines – is the US economy actually doing much better than widely expected?
Sadly not, there’s a snag. In fact, there are two. For one thing, last week’s numbers were revised up. So the improvement in IJC isn’t as big as it first appears.
But here’s the main point. A US state spokesperson has admitted the surprising drop may have stemmed from a variety of “technical” issues that were not picked up in the usual “seasonal adjustments”. In other words, there’s a glitch in the stats.
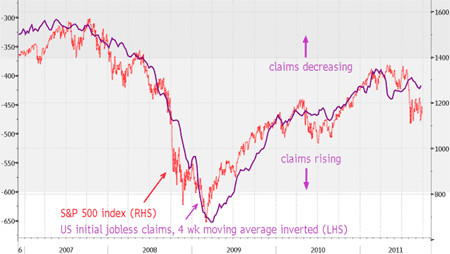
What does this mean for stocks? Clearly, this official fiddling around with the figures doesn’t help us. But here’s our regular chart…

Source: Bloomberg
The purple line is the inverted IJC four-week moving average. The higher this goes on the chart, the fewer claims are being submitted. So a rising purple line is good news, and a falling line bad news. The red line is the S&P 500 index, the world’s most watched stock market index.
Despite this week’s slight – and slightly suspect – drop in the IJC four-week moving average, the story is similar to last week. Overall, claims are still climbing. And that’s hardly encouraging for US – and global – stock market bulls.
Category: Economics

