GUALFIN, ARGENTINA — We have not had any word from our attorney in the city of Salta, but we assume the case was dropped.
Grand theft auto was the charge (catch up in full here).
But the alleged wrongdoer, your editor, claimed his actions were motivated by stupidity, not criminality.
Our ranch foreman Sergio came and switched the trucks.
With the cops off our trail, we turn back to the financial markets…
Doom Index
A dear reader helpfully suggested that we put together a “Doom Index” – with indicators of an approaching bust.
Our research team in Delray Beach, Florida, is working on it.
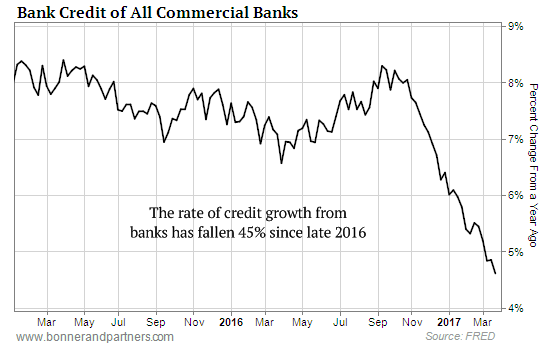
In the meantime, one doom indicator we highlighted earlier this week is the flow of credit.
This is an economy that depends on bank lending. If it slows, so does the economy. And credit growth is falling at a rate not seen since 2008.

Another indicator that will surely be a part of our Doom Index is the level of margin debt.
When an investor buys stocks on margin, he borrows the bulk of the purchase price from his broker.
Because he only puts up a portion of the total amount – the margin – he stands to gain more if the market goes up. But if the market goes down, he gets a “margin call.”
He has to put up his shares as collateral for his loan. His broker can now sell these shares (without notifying him) if he doesn’t meet his margin requirements.
“Markets make opinions,” say the old-timers. When stocks are near an all-time high, investors imagine they will only go higher.
But when they go down, all of a sudden they ask themselves why they ever bought them.
Squeezed and panicked, the margin buyer is forced to sell. And the higher the margin debt, the greater the number of shares that must be liquidated, sending the whole market down even further.
Today’s level of margin debt was last seen near the dot-com peak in 1999.
The Trump Factor
Margin debt figures are “hard data.” They show, in exact dollar terms, that investors are optimistic.
Consumers are optimistic, too. Consumer sentiment figures are “soft data.” They rely on mushy survey results.
But the two line up nicely – hard and soft – at 17-year highs.
On the surface, both types of data are remarkable. Why would investors borrow money to buy shares when stock prices are already as high or higher than ever in history?
The way to make money is to buy low and sell high. These investors seem to have it backward. They are eager to buy shares – on credit – at the highest prices ever seen.
Consumers should be gloomy, too. In fact, the hard data says they are gloomy.
They’re not spending.
Retail stores are closing at a faster rate than any time since the 2008 crisis.
Auto sales have slumped back to recession levels. (There’s a study from JPMorgan Chase that predicts used car prices will fall by half over the next five years.)
And mortgage payments are now the least affordable, compared to wages, than they have ever been.
How to account for such bullishness on the part of consumers and investors?
Donald J. Trump.
No Reagan Redux
Consumer confidence and the stock market shot up after Election Day.
Apparently, consumers and investors thought that Mr. Trump would make things better. But how, exactly, this was to happen has never been made clear… at least not to us.
The “Trump Trade” depended on so many unlikely and remote things.
Even if Team Trump could make fundamental improvements in regulations, taxation, or the deficit, the results wouldn’t show up for years.
It takes years for sensible infrastructure spending to get underway, for example.
After President Reagan took office, stocks fell, not rose. They kept going down for the next 17 months, wiping out 20% of the entire market value.
And that was when the Deep State insiders were just getting started.
Thirty-seven years ago, a determined majority, with a solid grip on Congress and a clear idea of what it was doing, could still control the government. Now it’s practically impossible.
And back then, the reformers had the wind at their backs. You could buy the Dow for one ounce of gold. (Now you need 16 ounces.) The nation had less than $1 trillion in debt. (Now it has $20 trillion.) The 10-year Treasury yield was over 15%. (Now it’s under 3%.)
In other words, investors and consumers had every reason for optimism in the Reagan Era. Things were almost sure to get better.
Now, they had better be careful. The winds have shifted.
Things are almost sure to get worse.
Regards,
![]()
Bill
Category: Economics

