Where’s the world economy heading next? Here’s one way of telling; keep a close eye on the price of ‘hard’ commodities – those that come out of the ground.
Before factories can make more finished products, they need extra supplies of raw materials. So if hard commodity prices are climbing, it’s a reliable indicator that global demand for goods is growing too.
And one specific raw material is very closely monitored as a useful forward indicator of future economic growth – copper.
What’s more, when the copper price is compared with the cost of another key commodity – oil – it’s also handy for forecasting where the stock market could be heading.
Right now, the copper/oil signal is flashing red…
The smartest metal in the world
Often described as ‘Dr Copper’, this is the metal with a PhD in economics. It’s one of the most important and widely-used base metals around. So demand for it rises and falls along with the strength and weakness of the wider economy.
Copper conducts electricity better than any metal except silver. Around two-thirds of all the copper produced is used in electrical applications. These include power generation and transmission, as well as circuitry, wiring and contacts for PCs, TVs and mobile phones.
Another quarter of the copper produced is used by the construction industry for plumbing, roofing and cladding. Then there are transport and medical applications. In particular the metal’s anti-bacterial qualities help to reduce the spread of disease.
By now you’re probably getting the picture about copper’s capacity to forecast the direction of economic growth.
The link to the oil price
Why, then, do we need to compare copper with oil?
Sure, the latter has a very wide range of industrial uses as well. And the world’s need for ‘black gold’ also rises and falls with the strength or weakness of the global economy.
But the world’s overall demand for oil tends to be less volatile, even during quite severe recessions, than it is for copper. And the supply of crude tends to be less variable too. So there aren’t such massive swing factors at work here.
Recent figures bear this out. In 2001, global oil use was 77 million barrels per day (mbpd). In 2011, it was 89.6 mbpd. That’s a rise of 16% in ten years. Even in 2009, a really nasty year for the global economy, global oil use only fell 2%.
Further, by 2015 the International Energy Agency expects global oil use to be around 99 mbpd, which would be a nice and steady 10% rise over a four-year period.
So you can see the significance of the copper price rising faster than the cost of crude. It’s a clear sign that not only is the world economy expanding, but also that the global growth rate is accelerating.
In addition, a rising copper/oil ratio is also a bullish sign for stock markets. That’s because an outperforming copper price will ultimately lead to higher profits being made by both miners and industrial firms around the world. In turn, that will drive up global equity prices.
A warning from Dr Copper
But what happens when we see the opposite?
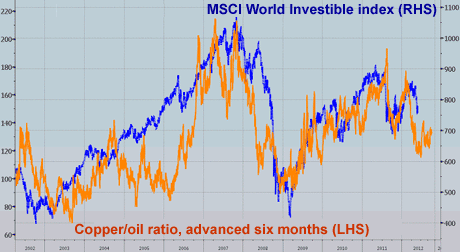
Take a look at the chart.

Source: Bloomberg
The blue line is the ten-year performance of the MSCI World investible index. This is a widely-watched global stock market gauge that until the last two months had been doing quite nicely in 2012.
The orange line is the copper/oil ratio. When this is climbing, it shows copper doing better than oil. Note that on the chart I’ve advanced this ratio by six months.
In the early part of the last decade, the copper/oil ratio didn’t move too closely with world stocks in the short-run. Yet as markets heated up in 2006 and 2007, the ratio developed some real predictive power.
OK, the ratio is more volatile even than the stock market. But it gave early warnings about both the 2007 market top and the 2009 low (note how the orange line moves ahead of the blue line in the middle of the graph above).
Further, it forecast the rally through to its early-2011 peak. Since then, though, it’s been in decline. In fact, both copper and oil prices have dropped in recent months, with the former now falling faster on balance. That’s a clear recipe for further falls in world stock markets.
What will happen next?
So what now for the copper/oil ratio? China holds the key. For years it’s been the driving force behind both global growth and the rise in the ratio. But as we’ve been warning in a whole string of articles, a sharp Chinese economic slowdown is now looming.
Indeed, the evidence is mounting that this could be very nasty. The preliminary HSBC China Manufacturing Purchasing Managers Index is a key indicator of the country’s manufacturing activity. The crucial level is a reading of 50 – anything below this implies economic contraction.
At the end of last week, the latest index figure was published. And in May the HSBC barometer fell to 48.7 compared with April’s 49.3. To put it another way, China’s influence on the copper/oil ratio looks set to be firmly negative for some time to come.
Category: Economics

