HEILIGENSTADT, VIENNA
Vienna as a whole is pretty flat.
However, we do have a hill here in Heiligenstadt.
To climb up it, from the Karl Marx-Hof at the bottom to the ZAMG – Austria’s Met Office – at the top, you traverse a 70-step staircase.
Fortunately, there are quite a lot of landings and only a very gentle incline when you reach the top.
The vineyards and the Vienna Woods are still a few minutes’ walk away.
It will take you about an hour by car or train to get to the nearest part of the Austrian Alps.
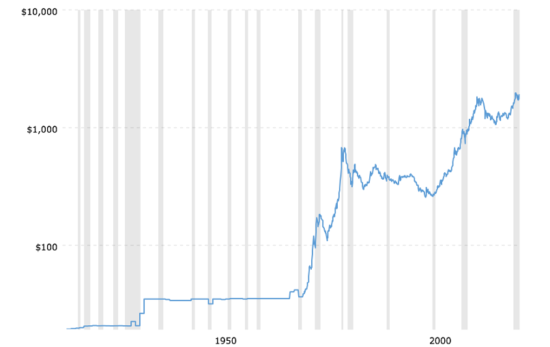
I was reminded of this topography by a chart which I had seen recently.
My colleague Charlie Morris brought it to my attention in this week’s edition of The Fleet Street Letter Wealth Builder, one of Southbank Investment Research’s for-subscription publications.
Charlie is a battle-hardened veteran of financial markets, having spent 17 years as the head of Absolute Return at HSBC Global Asset Management, managing more than £3 billion in client funds.
He kindly agreed that I could share this chart with you.
Gold price in US dollars per ounce over the last century
 Source: Macrotrends
There are several things to note about this chart.
The first is that it shows the price using a log scale.
Some of the rises in the last 20 years have been spectacular – more like the Himalayas than the Austrian Alps.
The second is that it shows the price in US dollars: had we used other major currencies, the picture would not have been radically different – and especially in the last 20 years – given the scale of the chart.
That is not to say that currency movements aren’t important.
For instance, in the short term it is quite possible that the price of gold will remain flat in US dollar terms, but that sterling will fall by 5% against the US dollar.
In this situation, the price of gold would rise by 5% in sterling terms.
In addition, notable bull markets for the price of gold have been few, but often spectacular.
Since 1920, there have only been four of them.
In 1930, there was a devaluation during the Great Depression – meaning that the number of dollars needed to buy an ounce of gold was increased.
The price then remained unchanged in US dollar terms at $35 per ounce until 15 August 1971.
Exit the Gold Standard; enter Volcker and Greenspan
Prior to that time, foreign governments with reserves in US dollars had been able to convert those reserves at the fixed and official price.
Then – almost exactly 50 years ago, as Boaz Shoshan reminded me the other day – US President Richard Nixon announced that these arrangements would no longer apply.
This was the end of what had been known as the Gold Standard: it was one of several measures that the Nixon administration took to counter inflation and unemployment – both of which were too high.
One of the consequences was that the price of gold soared, finally reaching a peak of around $850 per ounce in January 1980.
The price of gold then tracked sideways and/or sideways for over a quarter of a century.
During this period, Paul Volcker and Alan Greenspan were the chairmen of the US Federal Reserve (i.e. the central bank, often referred to by its nickname – the Fed).
As Charlie describes it, this was a period of “hard money”: both Volcker and Greenspan were determined to fight inflation in the United States.
The Fed’s key rate – the federal funds target – was, on average, about 3.3% higher than inflation during the 1980s and the 1990s.
What really matters for this discussion is that, under Volcker and Greenspan, the Fed did a good job in maintaining the value of the US dollar relative to gold.
What changed at the beginning of the 21st century was that the federal funds rate was allowed to become negative in real (i.e. after inflation) terms.
The “hard money” era was over.
Falling or negative real interest rates are normally very good for the gold price.
Now, the price of gold has basically moved sideways over the last year (given that it was also just below $1,800 per ounce in July 2020).
So, what’s next?
One thing that all of the Southbank Investment Research editors agree on is that the bull market for gold remains intact.
In October last year, Fortune & Freedom’s Nigel Farage published a report entitled Why gold could be the #1 asset to own for the next decade.
Negative real interest rates (as noted above, but globally and not just in the United States), and mounting inflationary pressures tend to boost the gold price.
Gold is often seen by investors as a “safe haven”.
A financial crisis that causes volatility in bond markets would, therefore, also likely boost demand for gold.
As I explained in yesterday’s edition of Capital & Conflict, such a crisis could start here in Europe.
The crisis could, for instance, begin if the European Central Bank (ECB) was compelled to stop being the lender of last (and first) resort to the Italian and Spanish governments.
It could also erupt if, for whatever reason, Germany’s Bundesbank (i.e. its national central bank) was unable/unwilling to increase its lending to the central banks of Italy and Spain.
The chart will continue to look less like a staircase and more like the Alps…
… in fact, we may only be in the foothills.
Andrew Hutchings
Managing Editor, Southbank Investment Research
Category: Economics

