In the New Year’s edition of MoneyWeek magazine, I gave my predictions for the year ahead, along with various other contributors.
I said that I was looking for a strong first quarter – with the risk trade back on – and that if the S&P 500 could get through 1,260, there was a good chance it could re-test the highs of 2011.
The S&P 500 is doing just that now. And the Dow Jones, which broke above 13,000 on Monday, has actually exceeded its 2011 highs.
I also said that I would be selling quite aggressively come the spring. It may not be spring quite yet, but I saw my first daffodil yesterday.
Should I stick to the plan? Is it time to start selling?
Forget opinions – the trend is all that matters
The short answer is no.
But the bottom line is that I don’t know and nor does anybody else. Anything could happen. Some kind of natural disaster could erupt, a war could break out, some insane new law or policy could be introduced – any of these could happen this afternoon. But the trend is up.
Trends can take a while to form, but when they do they are powerful things and the secret is to stay on, no matter whether it fits with your perception of the economy or not. My opinion does not matter at all. And nor does yours. What matters is the trend.
This is a stock market trend that has ignored the Greek crisis, escalating tensions in Iran, the impending bust of China’s property market, rising unemployment back home, the threat of a UK debt downgrade, excess debt worldwide and the inevitable end of our current monetary system. Heck, even Japan’s Nikkei looks strong.
This is a bull market that has ridden the proverbial wall of worry.
Maybe the global economy isn’t so bad after all. Maybe it’s a consequence of quantitative easing. Maybe it’s because there’s a whiff of spring in the air and the winter hasn’t been quite so cold after all. Maybe it’s the alignment of the stars. I don’t know why.
I can pretend to. I can go on the BBC and pretend to be a jolly clever economist and demand hundreds of thousands per year in consultancy fees and then declare that the market is irrational or blame Bernanke-and-King-created inflation when it doesn’t do what I want it to. But the reality is I just don’t know why markets move as they do. The reasons get attached afterwards.
But I do know the trend is up.
I can also observe. I note, for example, with considerable interest, that after the falls of 2008, it was very much commodities and emerging markets that were the leaders (they bottomed in November 2008; it was March 2009 before the US indices made their low).
Now, however, it is very much the US indices and in particular the large caps that are the setting the trail. The Dow is sitting just above its 2011 high, while for example, Brazil’s Bovespa, Canada’s exchanges and CRB (commodities) – all previous leaders – have a way to go. This applies to Canadian resource small caps, in particular.
There are any number of things you could read into this, but chief among them is: ‘America’s doing well right now’. And indeed it is. Just in time for President Obama’s re-election. Whodathunk it?
How to spot trends
So if the trend is ultimately what matters, how can you identify one when it forms? Here’s a simple tool for doing so. It’s a method I’ve written about before, but I’ve started to use different parameters because I found they work better.
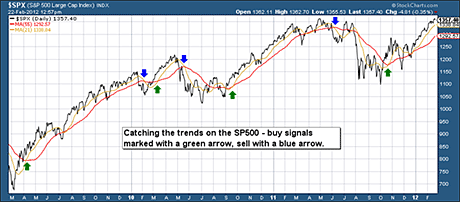
In the chart below, the black line shows the price of the S&P 500. The yellow line is the 21-day moving average (21dma) – the average price of the previous 21 days. The red line is the 55-day moving average (55dma).
When the yellow line crosses up through the red line, and both are either flat or sloping up with the price above both, that is your buy signal. I have marked the buy signals with a green arrow.
When the 55dma crosses down through the 21dma, both are either flat or sloping down with the price below, that is your sell signal. All the criteria have to be met – the cross, the slope and the price – otherwise the signal is incomplete. I have marked these with a blue arrow on the chart below.

(Click on the chart for a larger version)
This is not a fail-safe method. There is no such thing. And you tend to get caught out in a market that’s trading in a range, such as in early 2010. This can be annoying.
But it does make sure you catch the broader trends. And believe you me, sitting on the sidelines during a big move up, or being stuck in the market during a big move down such as we saw last year, are both far more painful.
With this method, you caught the big move of 2009, and of 2010-2011 – and you sat out the big falls of 2008 and 2011. You couldn’t ask for much more really.
Taking this method and looking at the broader markets, pretty much everything is on a buy signal – most equity indices, oil, most base and precious metals. The only sell I can find is the US long bond.
What does that mean? Put simply, risk is on, we’re in an inflationary phase, and you can put fears about deflation on the back burner for the time being.
I should stress, I expect some weakness here, given the run we have had since October, and that the US indices are up against their old highs. But that is just my opinion and means absolutely nothing. For now, the trend – the chap you want to befriend – is up.
Category: Market updates

