Today, I’m going to show you a simple technical signal.
It’s an alarm bell that has only sounded twice since 1995. The first time was in late 2000; the next time was early 2008. Both turned out to be extremely good sell signals.
Here’s the bad news. It has sounded again.
You do not want to be in this market.
The danger sign in the S&P 500 chart
My days of day trading are long gone. I wasn’t particularly good at it, and it took up too much of my energy. I prefer now to try to catch intermediate trends.
The indicator I want to show you today will never catch bottoms or tops, but it does tell you when to be in and out of a market.
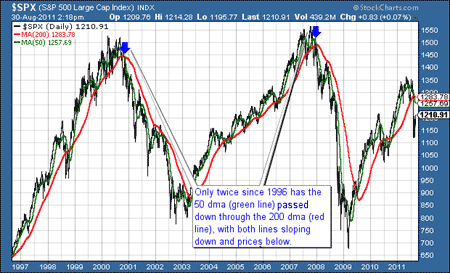
I’m going to ignore the news and the socio-economic fundamentals for a moment and just take a simple technical look at a chart of the S&P 500, which I like to use as my proxy for global stock markets. This is a chart of the S&P 500 since 1996.

The green line – the 50-day moving average (dma) – shows the average price of the previous 50 days. The red line shows the 200 dma.
On a number of occasions, such as last summer and the summer before, the 50 dma has broken down through the 200 dma. However, on these occasions, the 200 dma has still been sloping up (in other words, the long-term trend is still rising).
For the signal to be complete, both moving averages must be sloping down when the 50 dma crosses the 200 dma. Since 1996, this has only happened twice. As you can see on the chart above, once was in late 2000. The other early 2008. Both were times to get out of the stock market.
It’s happening again
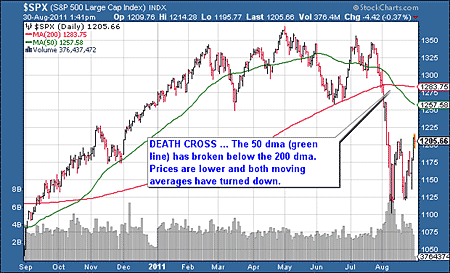
If we look at a more recent chart, we see that for only the third time in 15 years, the same signal has gone off.

This is one intermediate term, technical indicator, nothing more, but it has proved reliable in the past. And it is telling you to be out of the stock market.
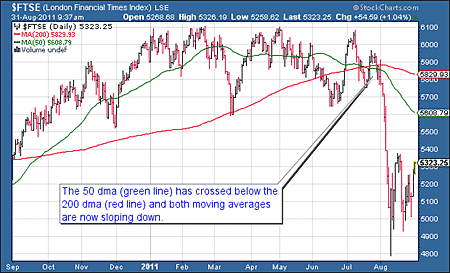
The same signal went off on the FTSE back in 2000 and 2008 and, as the next chart shows, it has just gone off again.

As far as commodities are concerned we also have a cross down on the CRB, but the 200 day moving average is still sloping up so the signal is incomplete. A few more weeks of steady or lower prices, however, will turn the 200 dma down.
The gold stocks indices, both senior and junior, are ok – just. But we have also have a sell on the CDNX, which is a composite of the Toronto and Toronto Venture exchanges, where many junior resource stocks trade.
I wouldn’t rule out a move up to 1,250 on the S&P 500 in the short term, or to 5,400 or 5,500 on the FTSE, but I stick with my call from March that we’re now in a bear market and that rallies should be sold.
Back in 2008, stock markets had an awful July. One comment, from James Harding of The Times, sticks in my mind from that time. Describing the many bankers who had taken the day off to watch the cricket, Harding said that Lords was “gripped by a communal sense of the jitters”.
In August 2008, we saw a rally on light volume. Then came the autumn capitulation.
This year, the feeling at Lords in July was rather more gloomy than a mere attack of “communal jitters”. And right now we are enjoying an August rally on light volume. Are we headed for another autumn capitulation?
I don’t know. Nobody does. But I can’t say I’m bullish.
Currency markets have been surprisingly calm
Of course, if you are avoiding the stock market, the question arises – where should you be holding your cash? For all this stock market volatility – not to mention the social and political upheaval we are seeing – the currency markets have been a haven of relative calm.
Against the euro, the pound has ranged from €1.10 to €1.16 since mid-March. Against the US dollar, the pound has ranged from $1.58 to $1.67.
Despite the fact that the eurozone is knocking hard on the gates of hell, its currency has also been relatively constant over the period, trading between $1.39 and $1.49. Meanwhile the US dollar index, which measures the dollar against a basket of major currencies, has stayed stable in the 72 to 76 range.
In 2008 the dollar was the place to hide. Should we get a repeat, it may well be again.
Or it may be that gold is the place to hide. In 2008, it lost some 20% against the US dollar, but actually rose against other currencies – sterling, for example. We’ll see what happens.
But I know what I’d rather own.
Category: Market updates

