Editor’s Note: Yesterday, markets closed in observance of Martin Luther King Jr. Day. Bill will resume his regularly scheduled dot-connecting tomorrow. Today, we invite you to enjoy something a bit different…
Below, a guest essay from master trader Jeff Clark. As you’ll see, Jeff agrees with Bill. Stocks are headed lower over the long term. But nothing ever goes straight down. Today, Jeff shows where he sees U.S. stocks going in the short term… and reveals how market traders can take advantage.
Regular readers of the Diary will remember that when I wrote to you recently, I told you that the bull market for stocks ended on December 31, when the S&P 500 closed below its 20-month exponential moving average (EMA).
The primary trend of the market had changed from bullish to bearish. But that doesn’t mean it will be a straight shot down.
Conditions at the start of the month were so oversold, I expected we would likely see a “snap-back” rally throughout the month of January.
So far, so good.
At writing, the S&P 500 is up 5% since the start of the year. Most technical conditions are not even close to being overbought yet.
So there’s still plenty of energy available to fuel a move higher.
There are two ways to get there…
Bulls Step Up
Stocks could just keep moving straight up from here. Buyers have been willing to step up on every minor decline over the past several sessions.
That tells us folks are eager to put their money to work. And with a high level of buying interest, we could see the upside target get hit well before the end of the month.
Or, we could get a pullback first – for at least a couple of days – followed by a rally into the end of the month.
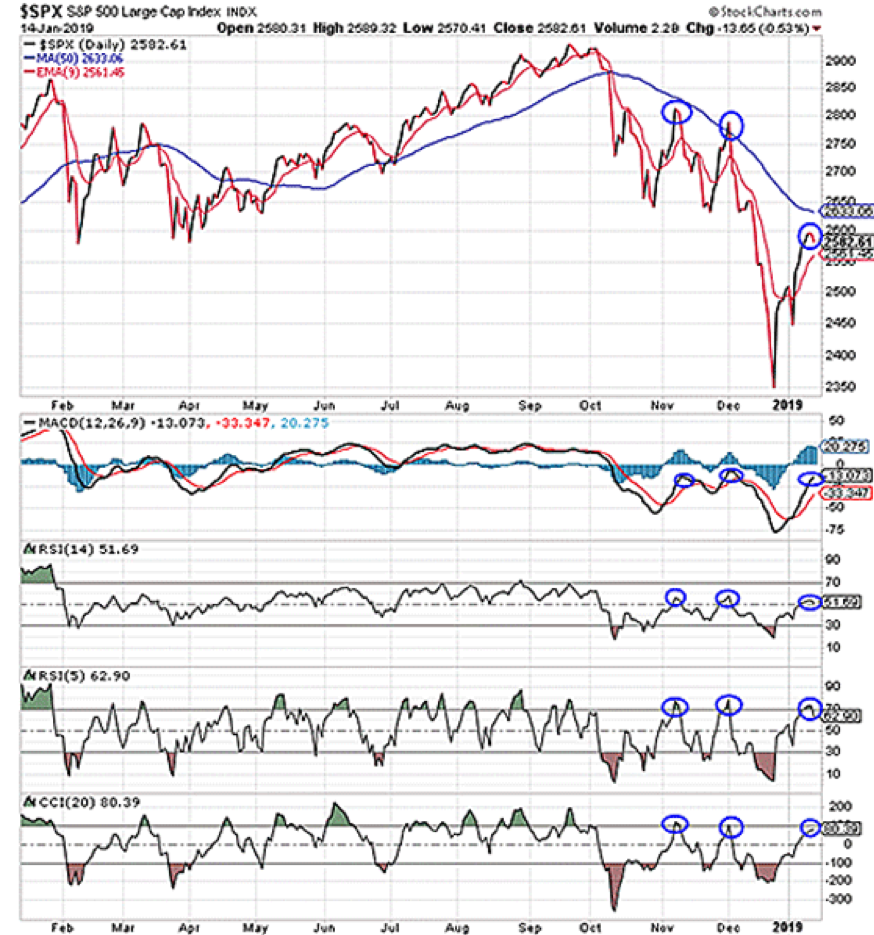
Take a look at this chart…
Now, if you’re not a trader, looking at that chart might have given you a heart attack. But don’t worry. Let me walk you through what you’re looking at.
First, have a look at the top chart of the S&P 500. The rally over the past two weeks has been pretty much straight up. The index gained nearly 150 points before taking a break last Monday.
As a result, all of the indicators in the lower half of this chart – which measure the general momentum of the market – have rallied back up to the levels at which they peaked (blue circles on chart) during market bounces in November and December.
If the market continues to play out a similar script, then it’s reasonable to expect at least some modest weakness from here. Maybe the S&P comes back down to the 2,560 level and tests its 9-day EMA as support.
Or maybe we get a stronger decline, to about 2,525, just to shake up some of the recently converted bulls.
Either way, a brief decline here should give traders a chance to add some long exposure in anticipation of a rally into the end of the month.
Long-Term Trend
My point is simple… whether stocks move straight up from here or we have to suffer a brief decline first, our upside target of 2,625 still looks like a good target. And if the buying pressure really kicks into gear, a move up towards 2,670 or so is possible.
Remember, though, what I wrote to you earlier this month. The long-term trend of the market has shifted. The bear is now in charge.
Traders should look to use this rally as a chance to reduce long exposure and possibly add some short exposure.
And if you’re not a trader? It’s never a bad idea to start thinking defensively.
The first thing you should do is try to remember how your portfolios fared in 2008. Were you comfortable just riding out the panic? If so, okay…
But if 2008 gave you nightmares about the losses in your portfolio, then you can do something today.
Either lighten up on stocks and raise some cash, or make sure you have stop losses in place.
As Bill has been telling you, this is all about protecting your capital.
And of course, gold is always a good thing to have. Maybe have 5% or 10% of your portfolio in gold. It’s not going to get ravaged in a bear market in stocks. And it’s a great way to store your wealth over the long run.
Best regards and good trading,

Jeff Clark
Category: Geopolitics


