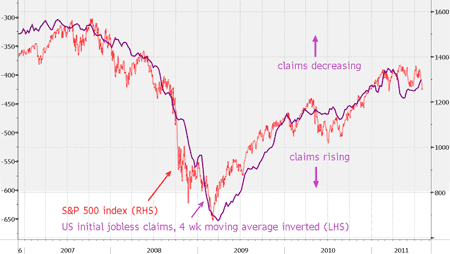
The latest US initial jobless claims (IJC) figures are out. These shows how many Americans are claiming state unemployment benefits for the first time. In particular the four-week moving average of IJCs, which filters out the weekly ‘noise’, has been a great pointer to future changes in both the US economy and the stock market too.
Why? Because more Americans at work means extra spending, extra growth – and likely higher share prices, too. But if US dole queues lengthen, the economy will suffer – and the rest of the world will feel the effects.
For the week to 30 July, IJCs dipped 1,000 to 400,000. That was in line with what economists were expecting. Meanwhile the four-week moving average dipped to 407,750, the lowest since mid-April.
What does this mean for the stock market? Look at the chart…it’s a bit of a turn up!

Source: Bloomberg
(Click on the chart for a larger version)
The purple line is the inverted IJC four-week moving average. The higher this goes on the chart, the fewer claims are being submitted. So a rising purple line is good news, and a falling line bad news. The red line is the S&P 500 index, the world’s most watched stock market index.
The IJC figures forecast its May drop, and also its June rally, very neatly. The S&P has since taken a real tumble. But the latest pick-up in the IJC four-week moving average suggests a rally may be in store – even if it doesn’t feel like it right now. Looking longer-term, though, the omens for US economic growth aren’t good, as John Stepek explains in today’s Money Morning: Is the bear market back?. And that would be bad for American jobs – and the S&P as well.
Category: Economics

