The Venture Exchange is Canada’s answer to London’s Aim exchange.
It’s where small-caps go to get listed.
As you might expect, being Canada, it is dominated by natural resources companies: mining, oil and gas exploration for the most, as well as a few tech companies. It’s a market for intrepid prospectors and scoundrels alike.
When it moves in your favour, it’s a fantastic market to be in. There can be huge gains. But when it goes the opposite way, it’s horrible.
Why do I mention it today?
Because I just got a buy signal…
How to trade one of the most volatile markets in the world
Let me give you an idea how volatile the Venture is. From its post-dotcom crash lows in 2003, the FTSE 100 moved from about 3,280 to 6,750 at its 2007 peak. That’s a little bit more than a double.
Over the same period, the Venture went from 890 to 3,370 – jumping more than three-and-a-half-fold.
On the flipside, during the 2007/08 financial crisis, the FTSE 100 went from 6,750 back to 3,460 (I’m using round numbers). So it halved, give or take.
The Venture meanwhile fell 80%, all the way to 680.
The Venture is not for the faint-hearted.
The secret – as with any market – has been figuring out when to be in, and when to be out. I’ve been studying this for many years, and have developed my own simple system.
This system does not catch the highs and lows. Somebody else can do the bottom fishing and have the first and last 10-15% of a move.
But it does make sure you catch trends. Trends are wonderful things to ride when the market is in your favour. They can go on for many years and many hundreds of percent.
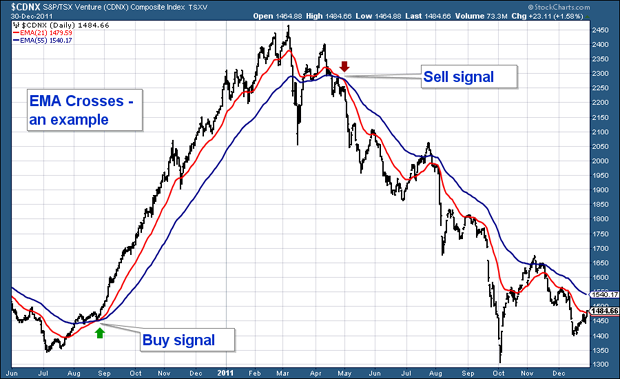
The system is based around moving averages. You need two moving averages – the 21-day and the 55-day exponential moving average (EMA). The 21-day EMA shows the average price of the previous 21 days, with the more recent days given extra weighting. The 55-day EMA does the same but for the previous 55 days.
On the chart below you see the price in black, the 21-day EMA in red and the 55-day EMA in blue. The signal is simple. It has three components: the red line (the 21-day EMA) has to have crossed up through the blue line (the 55-day EMA); both lines have to be either flat or sloping up; and the price has to be above both lines.
If these three conditions are met, you have your buy signal.
Similarly, when the price is beneath the averages and the 21 crosses down through the 55, with both sloping down, then you have your sell signal.
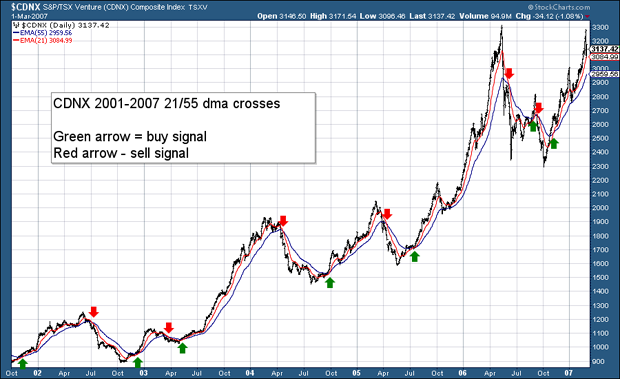
Below is a chart of the Venture between 2000 and 2007. I have marked the buy signals with a green arrow and the sells with a red. You can see how, while it has not caught the highs and the lows, the system has you in the market when it’s trending up, and out of it when its trending down.
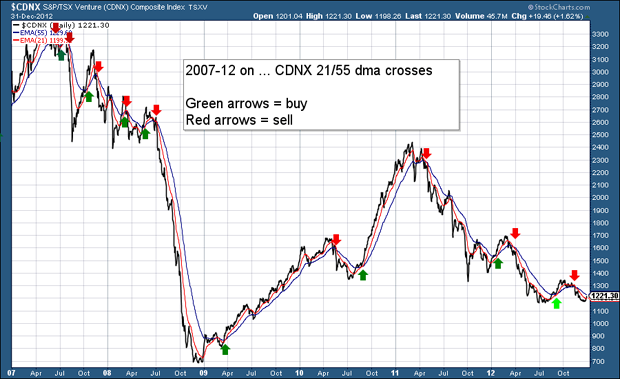
Below we have the exchange from 2008 to 2012. The system lost money in 2007-2008 during the whipsawing conditions. But here’s the main point – you were out of the market (or short) when it crashed so precipitously. It then got you back in for the wonderful booms of 2009 and 2010.
The Venture now has a ‘buy’ signal
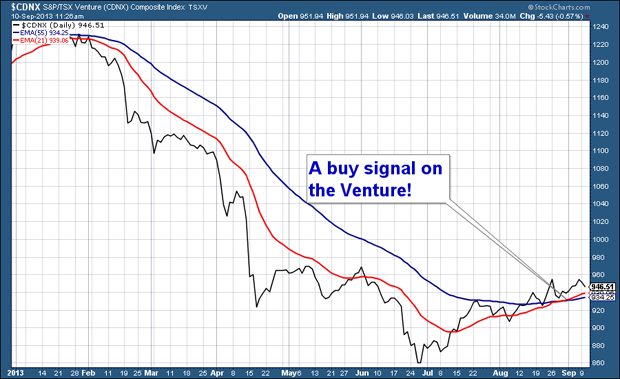
Here’s the good news. Towards the end of last week I got another buy signal, as shown on the chart below.
You can see the red line (21-day EMA) has passed up through the blue line (55-day EMA). Both are sloping up and the price sits above them:
I have to say this buy signal comes against my better judgement. A good 20- 25% of the 2,500 companies listed on the Venture have little (less than $100,000) or no working capital, such is the dire state of the market.
The exchange, which makes its money off the fees these companies pay to be listed, has changed its rules, enabling many to stay on the market. This has meant that, instead of the exchange being purged, zombies were created.
But the beauty of a simple technical signal like this is that it blocks out the noise. If I am to respect the method, then I must not impose my own prejudices on it. The evidence is that the system works – particularly if you go short on a sell signal.
So how do you play this? For a general play, the most liquid exchange-traded funds (ETFs) are found in the US. The junior mining ETF, (NYSE: JUNR) (base and precious metals) tracks the Venture fairly closely. With so many gold companies listed on the Venture, the gold explorers ETF, (NYSE: GLDX), also tracks the Venture a large part of the time – but not always.
The point is this: when the sector is trending up, most companies rise with it, whether good or bad. When the sector is sinking, most companies fall.
It’s like the housing market. Even the grimy flat above the kebab shop on the high street will rise in value when the market is strong. But when the market is weak you can’t sell it.
That said, if you are buying the natural resource stock equivalent of the flat above the kebab shop, it’s important to know that’s what you are doing, and to be aware of the risks.
Given that the Venture is pretty much the home of natural resources, I see this as a ‘buy’ on small-cap natural resource stocks – even the Aim-listed ones. So be long natural resource companies. I’ll let you know as soon as we get a sell signal, and we can see how we’ve done.
Natural resource companies – along with emerging markets – have been annihilated over the last two years. We are coming off extremely oversold levels. My first target on the Venture is around 1,170 – a little better than a 20% move from here.
Fingers crossed.
Category: Market updates


