Job indicators are good guides to how well an economy is really doing. More people working means extra spending and growth, and likely higher share prices, too. But if dole queues get longer, an economy and many of its businesses will suffer.
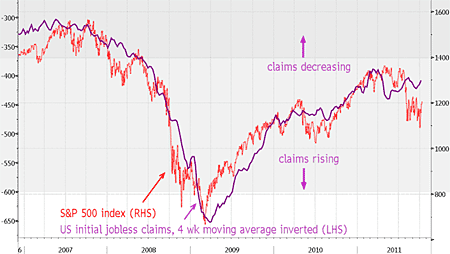
US ‘initial jobless claims’ (IJC) show how many Americans are claiming state unemployment benefits for the first time. And the four-week moving average of IJCs, which filters out the weekly ‘noise’, has generally been a handy pointer to future changes in both the US economy and the stock market.
For the week to 8 October, IJCs dipped by 1,000 to 404,000, slightly better than expected. And the IJC four-week moving average dipped by 7,000 to 408,000, the lowest level since mid-August.
What does this mean for stocks? Here’s our regular chart…

Source: Bloomberg
The purple line is the inverted IJC four-week moving average. The higher this goes on the chart, the fewer claims are being submitted. So a rising purple line is good news, and a falling line bad news. The red line is the S&P 500 index, the world’s most watched stock market index.
Recent falls in the IJC four-week moving average have been suggesting a market rally, and that’s what we’ve seen. But the jury is still out on how long this will last.
Category: Economics

