Right now, it’s hard to be bullish on anything. I hate to sound negative, but I have – and have had for some time – sell signals across the board. My own stance is to hold cash and gold, and take cover.
But which form of cash is going to prove least ugly for investors in the months ahead?
It’s been a while since I’ve done it – and it’s something I always enjoy doing – so I’m going to take a look at the foreign exchange (forex) markets in today’s Money Morning.
In particular, I’ll be considering charts of the euro, the US dollar and our once-great British pound…
The euro could still surprise everyone
Let’s look first at the euro against the US dollar.
Given that the world will end if Greece leaves the eurozone (or at least, that’s what some would have us believe), you would have expected the euro to be in some horrible dark place. It should be following the path of the Italian lira or the Greek drachma in the 1970s.
However, it’s not been quite the outright disaster you might have expected. The euro is in a downtrend, yes. It’s in a bear market, yes. But for all that, it’s still in better shape than it was when it first launched in the distant days of 1999.
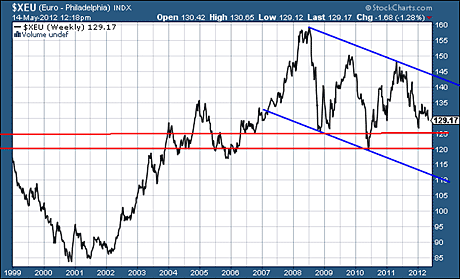
That’s not to say it can’t go lower. I’m sure it will. Look at the chart of the euro versus the US dollar below. The rate is in a clear downward channel, as defined by the blue lines.
There seems to be support in $1.20 and $1.25 areas, where I have drawn the two horizontal red lines. But the $1.05 – $1.10 area beckons.

The view from my humble corner of cyberspace is that the only solution for Greece, short of prodigious money printing by the European Central Bank, is for it to leave the euro. (The same goes for Spain, Portugal and, probably, Italy).
The sooner they do so, the sooner this euro bear market is likely to end. But while the political path of these nations is unresolved, the euro’s downward march will continue.
How a stronger pound could hit London house prices
That said, there is so much short interest at the euro, it really wouldn’t surprise me to see some kind of snap back rally as shorts cover. Perhaps a Greek default would do it.
This would cause it to rise against both the dollar and the pound – which we consider next. Amazingly, given the amount of quantitative easing that has gone on here, the pound looks very strong. It seems to enjoying some kind of safe haven role, which makes me snigger.
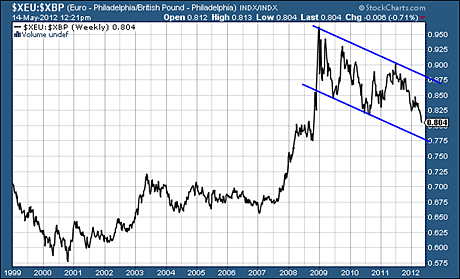
Here’s the euro against the pound since 1999. There is a similar channel in place, as defined by the blue lines. The euro seems to be quickly giving back all the gains it made between 2008 and 2010.
Given the clarity of that channel, it wouldn’t surprise me to see the euro below 70p – back in the range where it traded between 2003 and 2008 – by sometime in late 2013.

One of the odd side-effects of a stronger pound will be that central London property will no longer be so enticing to foreign buyers. Meanwhile, property in southern Europe, particularly Spain, will start looking very attractive to British buyers in want of a holiday home.
The American housing market is near the bottom
But what about the US? Is it time for us to start looking at real estate there?
I think the bear market in US housing is at or near a low. In some places it has probably already bottomed, or is bottoming. In others, there might be further declines. But the big falls have already happened.
For that reason, the risk to buying now is comparatively low, if your time frame is over several years. However, in some parts of the US, housing was actually cheaper to the UK investor back in early 2008. This is simply because of currency strength. Back then the pound was worth two US dollars. Now it’s more like $1.60.
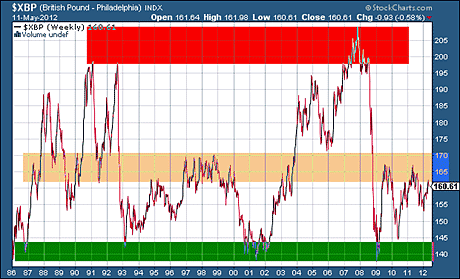
So where’s it headed next? Below is a chart I’ve used here a few times before. For those with longer-term horizons, the pound versus the dollar is a pretty simple trade. You sell the pound at $2 – or just above ideally – in the red zone. And you buy at $1.40 or just below – in the green.

I’ve painted that central zone in the dubious choice of colour common in so many houses, magnolia. That zone has proved support during periods of pound strength, such as in the late ‘80s or early ‘00s. It has proved resistance during periods of pound weakness, such as in the ‘90s and post-2008.
After the 1992 crash, it was ten years – 2003 – before it got through the magnolia zone. Based on this, it wouldn’t surprise me if we don’t get through $1.70 for another five years.
After the 1984 collapse in the pound, however – when it went almost to parity with the US dollar – it only took about two years to get back above $1.70. So maybe we won’t have to wait so long.
But I wouldn’t bank on it. As I’ve argued before, I think the bear market in the US dollar ended in 2008. It looks like another deflationary wave is well and truly upon us in which case, the dollar should do well.
In the short term the pound has turned down against the dollar having run into resistance in that magnolia zone. In fact, just about every equity market and commodity is in a downtrend now.
The pound tends to fall with equities, while the dollar tends to rise against them. So I see the pound continuing its fall. First stop $1.55. Longer term I expect some kind of range trade between the pound and the dollar, with $1.66-1.70 the cap and $1.40-1.45 the floor.
Category: Market updates

